Client-program health at a glance
One tile per managed program, coloured by composite health; the gauge is period NPS. Click a tile to pin it in the scorecard.
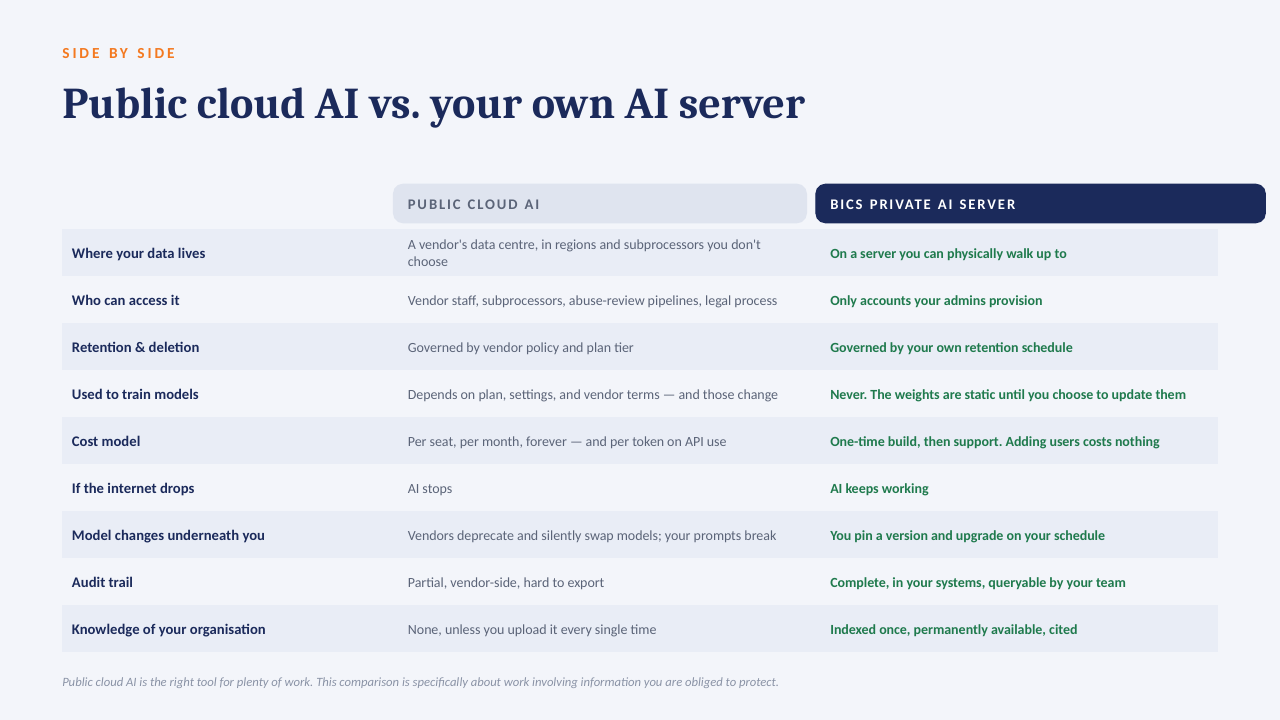
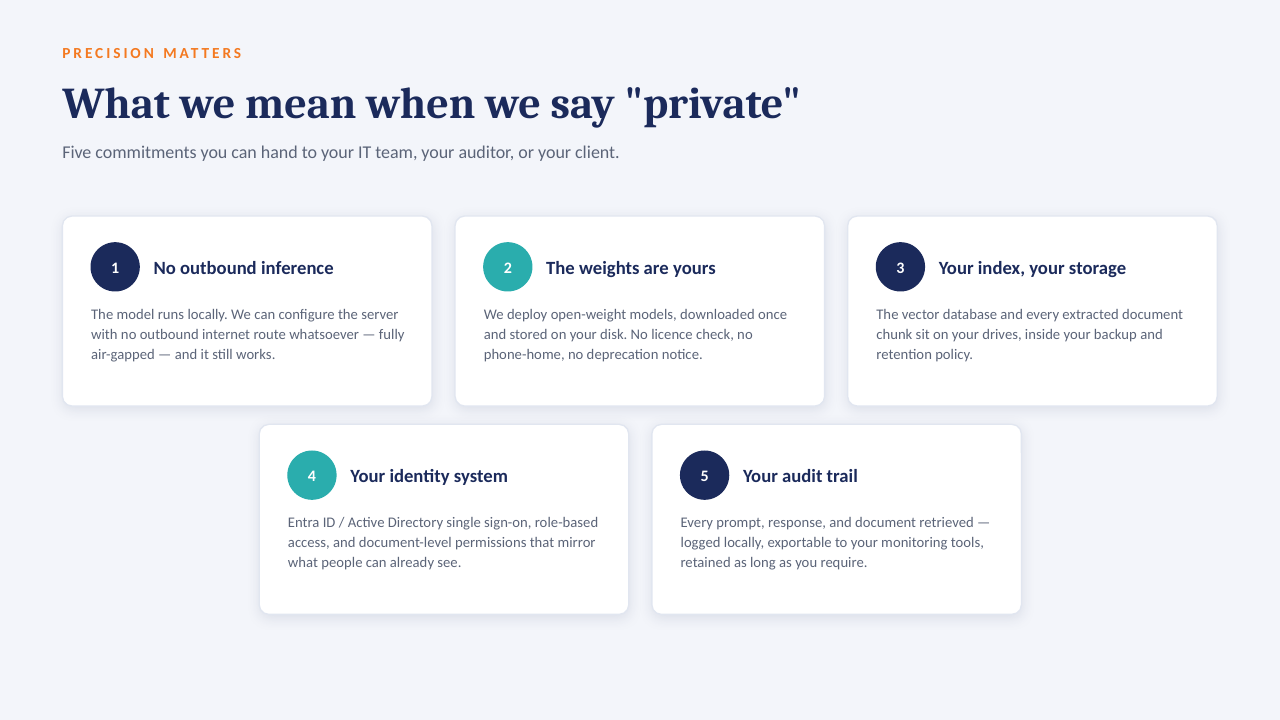
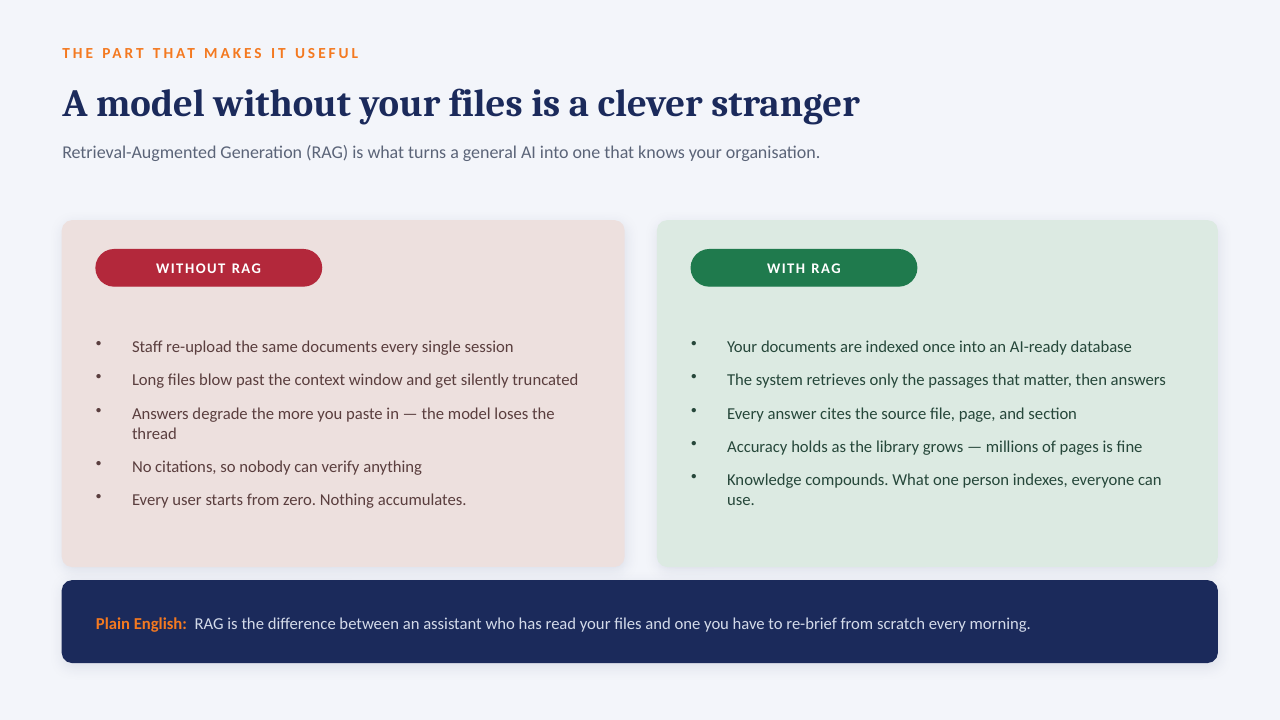
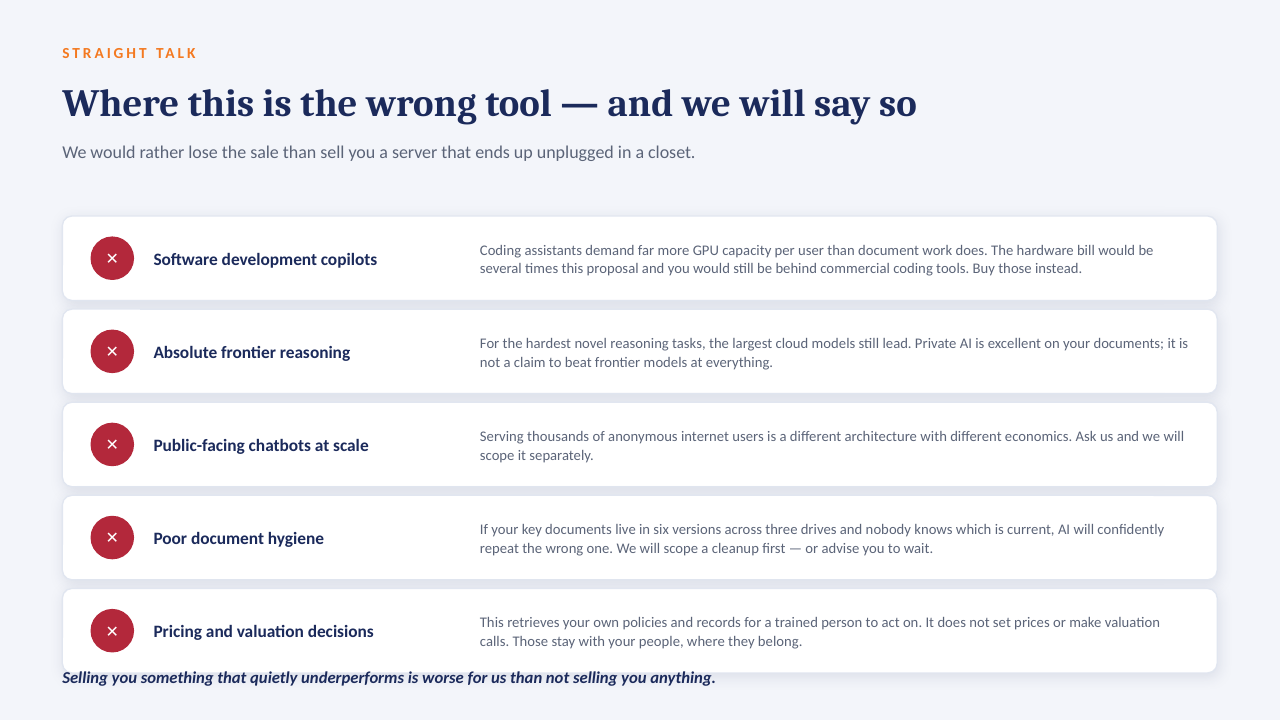
How four Airtable bases become one governed model
Record counts reflect the selected period. Airtable stays the operational system of record; Power BI owns the measures.
Forecast vs actual ticket / case volume
Seats staffed vs contracted
Dark bar = staffed core seats, light extension = surge seats drawn, tick = contracted.
QA audit scores by program
Average of scored interactions against the client rubric; target line at 92.
Program detail for the selected period
Sorted by health, then NPS. First-response figure is the period median in hours.
Natural-language questions over the same semantic model
† Topline NPS anchored to JDA TSG's published LegalZoom case-study figure of 90%+ NPS (published case-study figure; all other values illustrative). Client programs are labelled generically (Client A–L) and are not JDA TSG's real accounts or results. Founded 2011; enterprise clients named publicly by JDA TSG include Microsoft, Intuit, LegalZoom and the NFL. Illustrative dataset generated for demonstration; every figure recalculates from the same program table so subtotals reconcile.